FIG. 3.
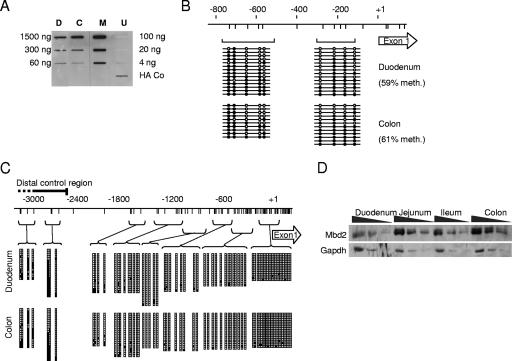
Comparison of MBD2 and DNA methylation levels in the duodenum and the colon. (A) Analysis of global methylation levels in duodenum (D) and colon (C) as determined by an affinity labeling assay with a HA-tagged poly-MBD domain reagent (16). M.Sss1-methylated (M) and nonmethylated bacteriophage lambda DNA (U) were positive and negative controls, respectively. The single HA-Co slot contained immobilized HA-tagged protein as a positive control for the anti-HA monoclonal antibody. (B) Bisulfite genomic sequencing of the Tff2 upstream region in duodenum and colon. The map shows the promoter region and first exon (open arrow). CpGs are represented by vertical lines. Brackets show PCR products amplified after bisulfite treatment. Empty circles represent unmethylated cytosine residues, and filled circles represent methylated cytosine residues. Each line corresponds to a sequenced DNA strand. (C) Bisulfite genomic sequencing of the p48 promoter in the colon and duodenum of wild-type mice. CpGs are represented by vertical lines. Horizontal lines linked to brackets show PCR products amplified after bisulfite treatment. Empty squares represent unmethylated cytosine residues, and filled squares represent methylated cytosine residues. Each row represents a single sequenced DNA molecule, and column height corresponds to the number of strands sequenced (i.e., 14 to 24) for each PCR product. (D) Western blot analysis for MBD2 and GAPDH in protein extracts from wild-type duodenum, jejunum, ileum, and colon. A twofold dilution series for each protein extract is shown.

