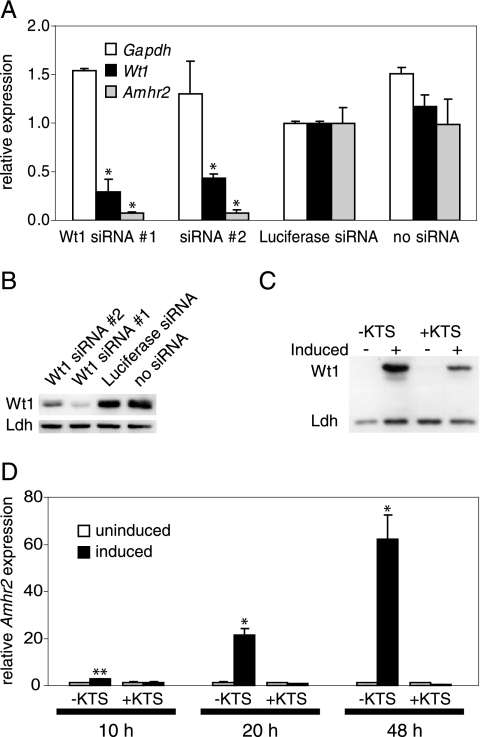
FIG. 3.
Amhr2 expression is altered by Wt1 knockdown and Wt1 induction. (A) M15 cells were treated with two different siRNAs directed against Wt1, an siRNA directed against luciferase, or transfection reagent only. Expression of Amhr2, Wt1, and Gapdh was measured 48 h after transfection by real-time RT-PCR and normalized to Actb expression. Expression levels in luciferase siRNA-treated cells were set as 1. Data represent the means and standard deviations of two independent experiments. Asterisks indicate statistically significant differences (P < 0.05; Student's t test) from expression in both controls (luciferase siRNA and cells not treated with siRNA). (B) Western blot analysis of Wt1 protein levels in siRNA-treated cells 48 h after transfection. Lactate dehydrogenase (Ldh) served as a loading control. (C) Western blot analysis of cells harboring an inducible allele of Wt1(−KTS) or Wt1(+KTS) 24 h after induction. (D) AMHR2 expression in uninduced and induced cells was measured by real-time RT-PCR 10 h, 20 h, and 48 h after induction of Wt1(−KTS) or Wt1(+KTS) in UB27 and UD28 cells. Expression levels were normalized to ACTB, and expression levels in uninduced cells were set as 1. Data represent the means and standard deviations of two independent experiments. Asterisks indicate statistically significant differences (*, P < 0.05; **, P < 0.01; Student's t test) from expression in uninduced cells.

