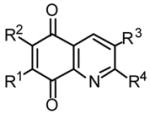
Table 2.
Structures of Quninoline-5,8-diones and Their In Vitro Differential Cytotoxicity
 |
|||||||||
|---|---|---|---|---|---|---|---|---|---|
| LC50 (μM)a | |||||||||
| Cell Linesb |
|||||||||
| No. | R1 | R2 | R3 | R4 | NRK | K/1 | H/1.2 | N/4.2 | 3LL |
| 3 | CH3COHN | H | H | CHO | 1.3 | 2.6 | 2.5 | NT | 1.2 |
| 4 | ClCH2CONH | H | H | CHO | 3.6 | 5.8 | 3.4 | 3.2 | 2.1 |
| 5 | n-C3H7COHN | H | H | CHO | 3.0 | >3.3 | 3.3 | >3.3 | 2.5 |
| 6 | i-C3H7COHN | H | H | CHO | >3.3 | 2.15 | >3.3 | >3.3 | 1.0 |
| 47 | CH3COHN | H | H | CH3a | 2.4 | 5.9 | 4.4 | NT | 2.0 |
| 48 | ClCH2CONH | H | H | CH3 | 3.2 | 6.6 | 2.8 | 3.4 | 2.3 |
| 49 | n-C3H7COHN | H | H | CH3 | 2.0 | >3.3 | >3.3 | >3.3 | 2.5 |
| 50 | i-C3H7COHN | H | H | CH3 | 1.5 | 7.5 | 1.45 | 1.15 | 0.71 |
| 51 | CH3CONH | H | CH3 | H | 1.3 | 1.8 | 1.1 | NT | 1.0 |
| 52 | H | CH3COHN | H | CH3 | 21.5 | >33 | 20 | NT | >33 |
| 53 | CH3CONH | H | H | COOH | >33 | >33 | >31 | NT | 26 |
| 54 | H2N | H | H | CH3 | 0.8 | 1.3 | 0.6 | NT | 0.8 |
| 55 | H2N | H | H | CHO | 2.4 | 4.3 | 2.2 | NT | 2.3 |
| 56 | CH3O | H | H | CH3 | 6.9 | 11.8 | 4.2 | NT | 7.4 |
| 57 | HO(CH2)4NH | H | H | CH3 | 10.5 | 13.5 | 10.5 | NT | 3.8 |
LC50 is the concentration of analogue that afforded 50% reduction in colony number after a 5-day incubation. Most of the reported values are derived from representative experiments performed in triplicate and interpolated from at least eight different concentrations of drugs ranging from 0.01 to 33 μM. Those values reported as > 3.3 were determined in screening assays where only two concentrations of drug were used, i.e. 3.3 and 33 μM. All experiments were performed at least twice and the data presented for each compound is that obtained from one experiment. See Experimental Section for culture details. NT = Not tested.
Cell lines: NRK, normal rat kidney epithelial; K/1, K-ras transformed normal rat kidney epithelial; H/1.2, H-ras transformed normal rat kidney epithelial; N/4.2, N-ras transformed normal rat kidney epithelial; and 3LL, Lewis Lung carcinoma.
