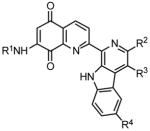
Table 4.
Differential Indices of Lavendamycins
 |
||||||||
|---|---|---|---|---|---|---|---|---|
| Differential Indexa |
||||||||
| Tumor Cell Linesb |
||||||||
| No. | R1 | R2 | R3 | R4 | K/1 | H/1.2 | N/4.2 | 3LL |
| 19 | CH3CO | CO2CH2CH3 | H | H | 7.5 | 0.8 | 0.7 | 0.1 |
| 20 | CH3CO | CO2CH(CH2)5 | H | H | 1.7 | 1.0 | 1.0 | 0.7 |
| 21 | CH3CO | CO2C5H11-i | CH3 | H | 0.9 | 1.1 | 1.2 | 0.6 |
| 22 | CH3CO | CO2CH2CH2N(CH3)2 | H | H | 2.6 | 1.5 | 1.3 | 0.7 |
| 23 | CH3CO | CO2CH2CH2N(CH3)2 | CH3 | H | 1.5 | 1.0 | 1.0 | 0.2 |
| 24 | CH3CO | CO2C4H9-n | H | OCH3 | 1.1 | 1.2 | 1.1 | <0.7 |
| 25 | CH3CO | CO2C4H9-n | H | F | 1.9 | 0.9 | 0.8 | 0.3 |
| 26 | ClCH2CO | CO2CH3 | CH3 | H | 0.7 | 1.0 | 0.8 | 0.3 |
| 27 | CH3CO | CO2C4H9-n | H | OCH3 | 1.1 | 1.2 | 1.1 | <0.7 |
| 28 | ClCH2CO | CO2C8H17-n | H | H | >2.2 | 1.0 | 1.0 | 1.0 |
| 29 | n-C3H7CO | CO2CH3 | H | H | 1.4 | 1.1 | 1.1 | 0.5 |
| 30 | n-C3H7CO | CO2CH3 | CH3 | H | 1.0 | 0.8 | 0.8 | 0.4 |
| 31 | n-C3H7CO | CO2C5H11-i | H | H | 1.6 | 2.7 | 1.5 | 0.4 |
| 32 | n-C3H7CO | CO2C8H17-n | H | H | >10 | 2 | >2.2 | >2 |
| 33 | i-C3H7CO | CO2CH3 | H | H | 1.4 | 1.1 | 1.1 | 0.5 |
| 34 | i-C3H7CO | CO2C4H9-n | H | H | 2.3 | 1.5 | 1.8 | 1.0 |
| 35 | H | CO2CH3 | CH3 | H | 3.2 | 0.9 | 1.6 | 0.4 |
| 36 | CH3CO | H | H | H | 0.9 | 1.0 | 0.8 | 0.1 |
| 37 | CH3CO | CH2OH | H | H | 1.2 | 1.2 | 1.1 | 0.6 |
| 38 | CH3CO | CO2H | H | H | 2.1 | 1.4 | 1.5 | 0.4 |
| 39 | CH3CO | CONH2 | H | H | 2.5 | 1.5 | 4.1 | 4.3 |
| 40 | CH3CO | CO2CH3 | H | H | 4.5 | 1 | 1 | 0.6 |
| 41 | CH3CO | CO2C5H11-i | H | H | 18 | 1.1 | 1.1 | 1.0 |
| 42 | CH3CO | CO2C8H17-n | H | H | >132 | 4.3 | 3.6 | 1.0 |
| 43 | CH3CO | CO2CH2Ph | H | H | 1.0 | <0.9 | <0.3 | <0.3 |
| 44 | CH3CO | CO2CH3 | CH3 | H | 9.0 | 1.3 | N.T. | 0.03 |
| 45 | ClCH2CO | CO2C5H11-i | H | H | 2.4 | 1.0 | 1.1 | 0.4 |
| 46 | n-C3H7CO | CO2C4H9-n | H | H | 1.3 | 1.6 | 0.9 | 0.3 |
Differential index of cytotoxicity was determined by dividing the LC50 value for the normal rat kidney epithelial cells ( NRK) by the LC50 value for the tumor cells. Index values for analogues which reflected LC50 activity at concentrations at least two times lower toward tumor cells than to normal cells are shown in bold.
See footnotes for Table 2.
