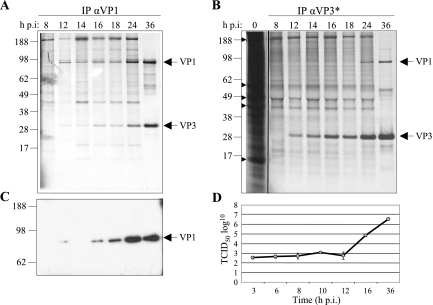
FIG. 4.
Kinetics of in vivo VP1-VP3 interaction. CHSE-214 cells infected with IPNV were metabolically labeled with [35S]methionine/cysteine for 3 h and harvested at 8, 12, 14, 16, 18, and 36 h p.i. IP was performed with a VP1 antibody (αVP1) (A) or with polyclonal VP3 antiserum (αVP3*) (B). Arrowheads point to highly abundant proteins in mock-infected cell lysates. (C) Western blot analysis of immunoprecipitates using αVP1 as the primary antibody. IP was preformed on cell lysates harvested in parallel to the experiments in A and B by using αVP1. Positions of viral proteins and sizes of marker proteins (in kDa) are indicated. (D) Virus titers were determined in cell supernatants from infected CHSE-214 cells at 3, 6, 8, 10, 12, 16, and 36 h p.i. The estimated 50% tissue culture infective dose is shown as the average for three parallel wells of infected cells. Three independent experiments were performed with similar results.

