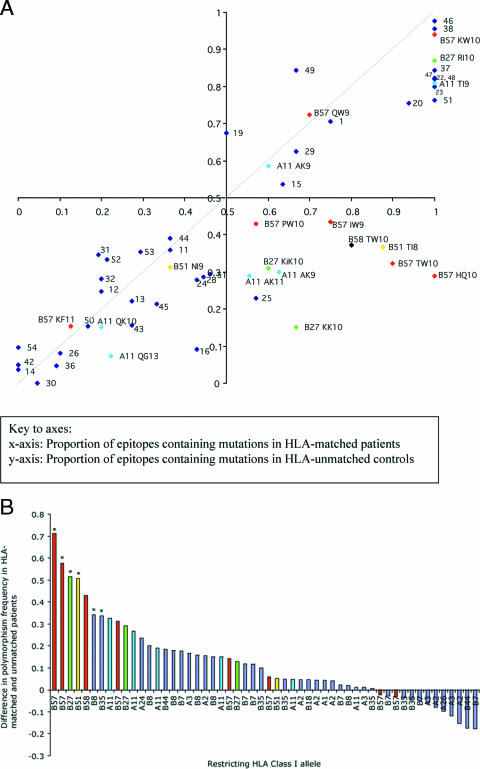
FIG. 2.
Prevalence of mutations within epitopes in HLA-matched and HLA-unmatched control patients in a Swiss cohort. (A) Patients are from the Swiss HIV cohort (n = 84). For 54 HLA class I-restricted optimal epitopes, the proportion of variant sequences in patients expressing the relevant HLA class I allele (matched) is plotted on the x axis, and the proportion of variant sequences in a control group of patients not carrying that allele (unmatched) is plotted on the y axis. The axes intersect at (0.5,0.5) rather than (0, 0) in order to define four equal quadrants within the figure. The dashed line represents x = y. Epitopes restricted by HLA-B27, -B51, -B57, -B58, and -A11 are color coded and labeled. All other epitopes are represented as numbered blue dots (see Table S1 in the supplemental material for a key to this labeling). (B) The difference between the proportions of polymorphic epitopes in the HLA-matched and -unmatched Swiss patients was calculated and plotted according to rank. To highlight the dominant contribution of the protective HLA class I alleles HLA-B57 and -B58, HLA-B27, HLA-B51, and HLA-A11, these epitopes are color coded; all other epitopes are represented in blue. An asterisk above a column indicates a P value of <0.05 for the distribution of variant epitopes in HLA-matched and -unmatched populations for each epitope using Fisher's exact test.

