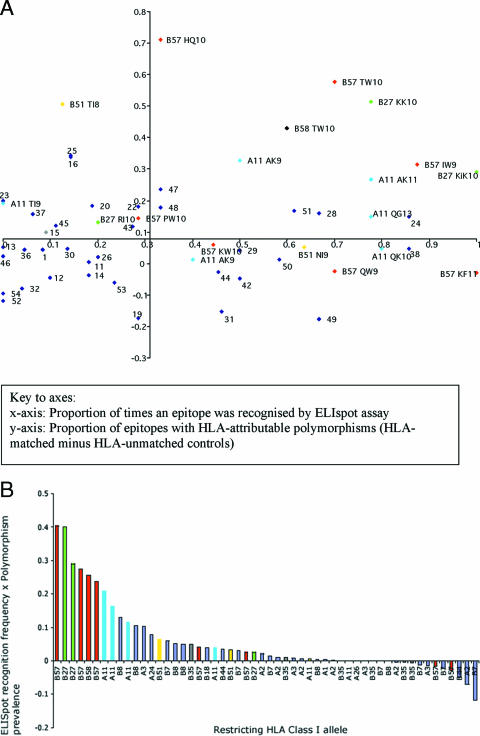
FIG. 4.
Frequency of epitope recognition by ELISPOT and prevalence of intraepitopic polymorphisms. (A) Each optimal epitope was represented on a plot according to the proportion of patients who recognized it in a gamma interferon ELISPOT assay (x axis) and the difference in proportions of polymorphic sites in the HLA-matched and -unmatched patients (y axis). The axes intersect at the median value for each distribution. Epitopes restricted by protective (HLA-B27, -B57, -B58, and -A11) HLA class I molecules are labeled (restricting HLA class I allele and epitope abbreviation) and color coded. All other alleles are represented in blue and are numbered (a key to the numbering is available in Table S1 of the supplemental material). (B) A score was calculated for each epitope based on the product of the proportion of times it was recognized in an ELISPOT assay and the difference in proportion of variant sequences in HLA-matched and -unmatched patients. This quality score is presented plotted in order of rank. The epitopes restricted by HLA-B57 and -B58, HLA-B27, HLA-B51, and HLA-A11 are color coded; all other epitopes are represented in blue.

