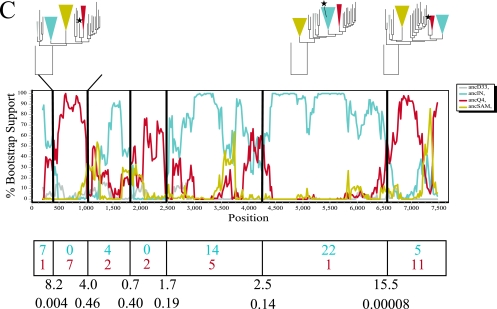
FIG. 2.
Phylogenetic, bootscan, and informative site analyses of three sample recombinant sequences: (A) TV002, (B) 00BW192113, and (C) 98IN012. The maximum-likelihood phylogenetic trees, constrained on phylogenetically defined clusters based on the ancestral reference sequences used in bootscanning (the ancestor to the Indian cluster [ancIN], the ancestor to the South American cluster [ancSAM], and ancestors to other arbitrarily named clusters [ancD33, ancG3, ancQ4, ancT13, and ancT17]), are shown above regions flanking significant breakpoints. The colors of the branches and constrained groups match the colors of the representative sequences in the bootscan analysis. The putative recombinant sequence is labeled with a star. The bootscan analysis was performed using a window size of 400 bp and a step size of 20 bp. The graph represents the bootstrap support for clustering with each of the putative parental sequences (ancIN, ancSAM, ancD33, ancG3, ancQ4, ancT13, ancT17, and SK213). Putative recombination breakpoints are shown as black vertical lines. The number of informative sites of the query sequence matching each putative parental sequence for each region is shown below the graph in the corresponding color. The Yates-corrected chi-square value and the corresponding P value are shown below each breakpoint. The times of origin of the most recent ancestors to the recombinant sequences were as follows: (A) 1982 (95% CI, 1963 to 1988) for the portion of TV002 most related to ancT13 and 1973 (95% CI, 1956 to 1977) for the portion most related to SK213, (B) 1970 (95% CI, 1954 to 1976) for the central portion of 00BW192113 most related to ancT17 and 1980 (95% CI, 1968 to 1983) for the 3′ portion most related to ancG3, and (C) 1974 (95% CI, 1943 to 1979) for the central portion of 98IN012 most related to ancIN and 1970 (95% CI, 1960 to 1978) for the 3′ portion most related to ancQ4.


