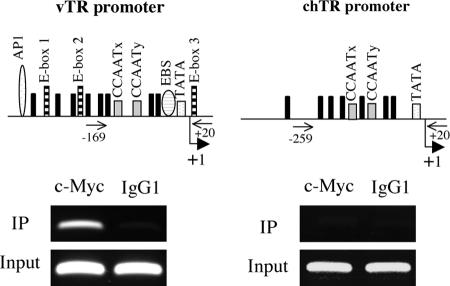
FIG. 7.
Direct association of c-Myc with the vTR promoter. Schematic diagrams of the vTR promoter (left) and the chTR promoter (right) are shown at the top. The pairs of primers used for the PCR amplification are indicated on the schematic diagrams of the two promoters. Electrophoretic analysis of the PCR amplification products, using immunoprecipitated DNA (IP) or total input DNA (Input), is shown below. Mouse IgG1 antibodies (right column) were used in ChIP assays as a negative control. The column on the left shows the PCR amplification products from DNA immunoprecipitated with c-Myc antibodies. vTR promoter-specific primers amplified a 189-bp product, whereas chTR promoter-specific primers amplified a 279-bp product.

