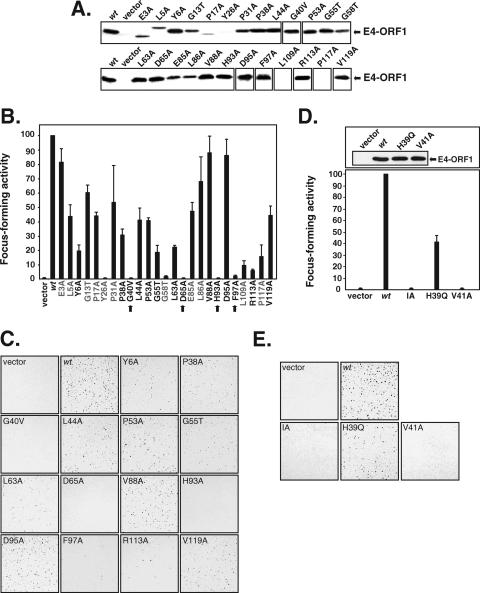
FIG. 2.
Protein expression and cellular transformation phenotypes of 25 new Ad9 E4-ORF1 mutants. (A) Transient expression levels of E4-ORF1 mutant proteins. CREF fibroblasts on 6-cm dishes were transfected with 3.5 μg of empty pJ4Ω plasmid (vector) or pJ4Ω plasmid coding for either wt E4-ORF1 (wt) or the indicated mutant E4-ORF1. An equivalent amount of each cell extract (100 μg protein) was immunoblotted with E4-ORF1 antibodies. Two separate controlled experiments are presented in the top and bottom rows, with double vertical lines denoting the locations of deleted irrelevant lanes. Similar results were obtained in four independent experiments. (B) Cellular transforming activities of E4-ORF1 mutants. CREF fibroblasts were transfected with empty pJ4Ω plasmid (vector) or pJ4Ω plasmid coding for either wt E4-ORF1 (wt) or the indicated mutant E4-ORF1, as for panel A. Transformed foci were counted at 3 weeks posttransfection. Focus-forming activity is reported as the percentage of foci generated by each E4-ORF1 mutant relative to wt E4-ORF1, which was set at 100%. Data compiled from three independent experiments include the means plus standard deviations. The names of mutants with or without protein expression defects, as determined by data presented in panel A, are colored gray or black, respectively. The arrows point to candidate domain 2 mutants. (C) Photographs of selected focus formation assays quantified in panel B. Only expression-competent Ad9 E4-ORF1 mutants are shown. (D) V41A is the crucial mutation in mutant IA. Focus formation assays in CREF fibroblasts were carried out, quantified, and presented as described for panel B. Data compiled from two independent experiments show the mean plus the range. The immunoblot assay comparing E4-ORF1 protein levels (top) was conducted as described for panel A. (E) Photographs of focus formation assays quantified in panel D.

