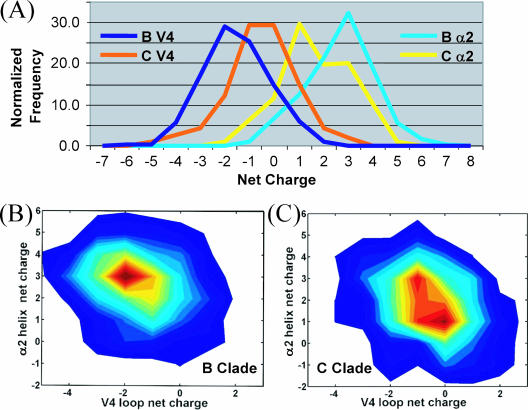
FIG. 2.
Nature and correlations of charge distributions in α2 and V4 regions. (A) The net charge distributions are given for α2 (B, light blue; C, yellow) and V4 (B, dark blue; C, dark orange) regions of clades B and C. (B and C) Contour plots showing the correlation between net charges from α2 and V4 regions for clades B (B) and C (C). In clade B, +3 and −2 are the predominant set of preferred net charges for α2 and V4, whereas, a few sets of preferred net charges exist in clade C and are related to the different lengths of V4. Short and long V4 lengths contribute to peaks at +3 and −1 and +1 and −1 for α2 and V4, respectively, whereas medium V4 lengths (25 to 30) dominate the peaks at +1 and 0.

