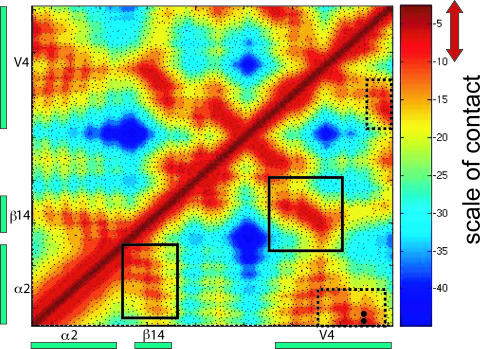
FIG. 3.
Distance matrix identifying the contacts proximal to α2 helix in gp120. This distance matrix shows the α2-helix-to-V4 region and was obtained from all-atom molecular dynamics simulations of gp120 in aqueous solution. The color gradient shown on the right indicates the spectrum of proximity (in Å), with red representing shorter and blue representing longer distances between residues. A potential contact is defined when two C-α atoms are less than 10 Å from each other, as shown with a red double arrow. Boxes with solid lines show contact between the C-terminal halves of α2 and β14; boxes with dashed lines show contact between the N-terminal half of α2 and the C-terminal half of V4. Black dots show pairs of residues with statistically significant charge complementarity.

