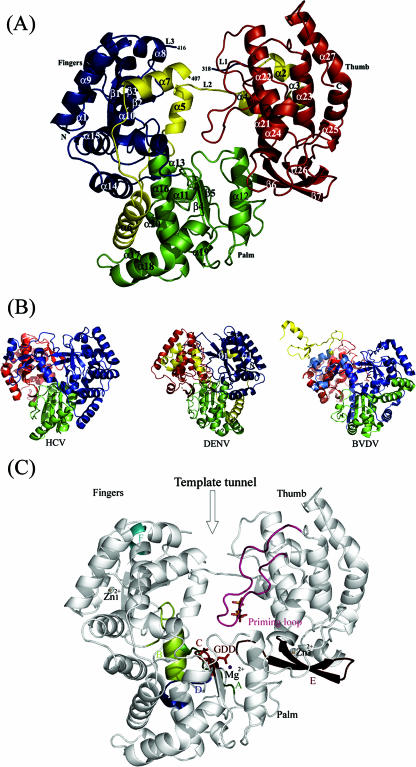
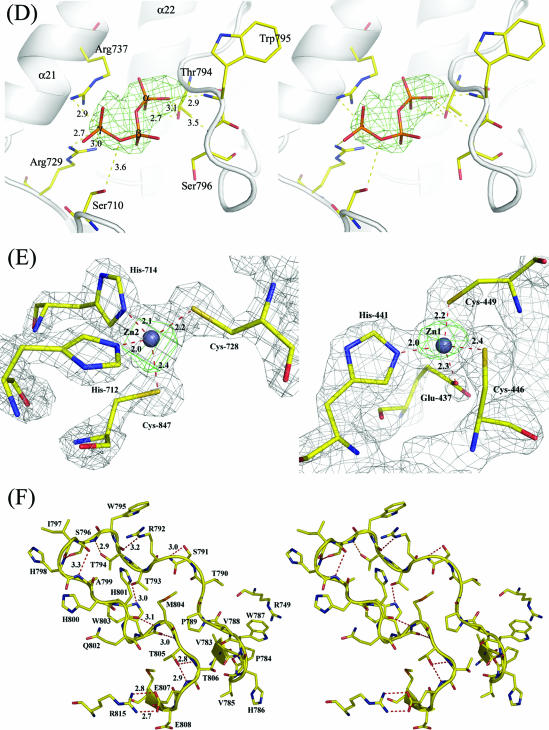
FIG. 2.
(A) Ribbon representation of overall structure of DENV 3 RdRp (residues 273 to 900). The various subdomains are colored as follows: fingers, blue; NLS, yellow; palm, green; and thumb, red. Secondary structure elements, as defined in Fig. 3, are labeled. The N and C termini are displayed, and the residues at the boundaries of the missing regions in the model are numbered. (B) Side-by-side views of the DENV, HCV, and BVDV RdRps, highlighting their structural differences (see the text for details). (C) The six conserved motifs present in various RdRp structures were mapped onto a ribbon representation of the DENV 3 RdRp catalytic domain and colored as follows: motif A, dark green; motif B, green; motif C, red; motif D, dark blue; motif E, magenta; motif F, light blue; and priming loop, pink. Asp-663 and Asp-664 from motif C of the catalytic site are shown in stick representation and labeled. The divalent metal ions Zn2+ and Mg2+ are represented by gold and purple spheres, respectively. An anomalous Fourier map contoured at a level of 5 σ shows two peaks at the positions corresponding to the two zinc ions. (D) Stereoviews of the interactions established by the tP moiety of the 3′dGTP inhibitor. The final difference electron density map with Fourier coefficients Fo-Fc, where the atoms from the inhibitor have been omitted from the calculation, was contoured at 3.0 σ. Residues Ser-710, Arg-729, Arg-737, Thr-794, Trp-795, and Ser-796, which are making contacts, are represented as sticks, and the distances to the α-, β-, and γ-phosphates are displayed. (E) Close-up view of the zinc binding pockets (left panel, Zn2; right panel, Zn1) located in the vicinity of motif E in the thumb and within the finger subdomains, respectively. The zinc ions are displayed as gray spheres, and residues providing the tetrahedral coordination geometry are shown as sticks. The refined electron density map (with Fourier coefficients 2Fo-Fc) is displayed at a level of 1 σ. The anomalous Fourier maps using phases from the refined final model are contoured at a level of 5 σ and displayed in green. (F) Stereoviews of the interactions of the primary loop (see text for details).


