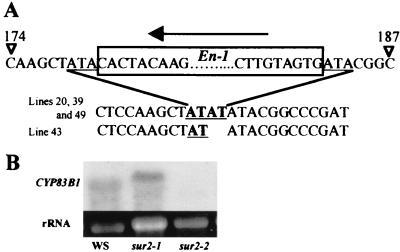
Figure 2.
(A) Footprint mutations in the four lines that did not show the cosegregation between the sur2 phenotype and the En-1 insertion. The 3-base target site duplication (ATA) is underlined. Bases in bold and underlined represent the insertion footprints. An arrow shows the 5′ to 3′ orientation of the En-1 element. (B) Expression of SUR2 in sur2–1 and sur2–2 alleles. A Northern blot with total RNA from wild-type (WS) and sur2–1 and sur2–2 homozygous seedlings was hybridized with the full-length cDNA as a probe.

