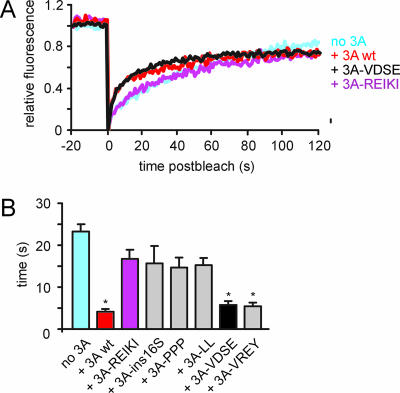
FIG. 5.
Effects of 3A mutants on Arf1 dynamics. The upper panel shows FRAP traces for cells expressing Arf1-YFP either alone (no 3A) or together with CFP fusion proteins of wt 3A, 3A-REIKI, and 3A-VDSE. The FRAP traces for Arf1-YFP in cells expressing 3A-ins16S, 3A-PPP, and 3A-LL were similar to that observed for cells expressing 3A-REIKI (and are therefore not shown). The FRAP trace for Arf1-YFP in cells expressing 3A-VREY was similar to that for cells expressing 3A-VDSE. The lower panel shows half-times of fluorescence recovery of Arf1-YFP expressed alone or together with wt 3A, 3A-REIKI, 3A-ins16S, 3A-PPP, 3A-LL, 3A-VDSE, or 3A-VREY. The traces show the average recoveries (n ≥ 10 cells) for at least two independent experiments. The fluorescence intensity was calculated as described in the legend to Fig. 4.

