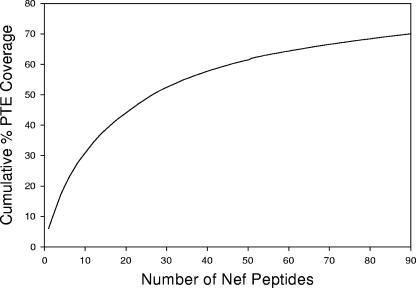
FIG. 1.
Schematic representation of the PTE frequency coverage plot for the Nef PTE peptide set (n = 90 peptides). The PTE frequency coverage plot shows the number of 15-mer peptides relative to the cumulative PTE coverage for 110 Nef sequences. Ninety peptides were required to achieve a cumulative coverage of 70%. The PTE peptides with lower numbers are those that are present at the highest frequency among the virus sequences in the database.

