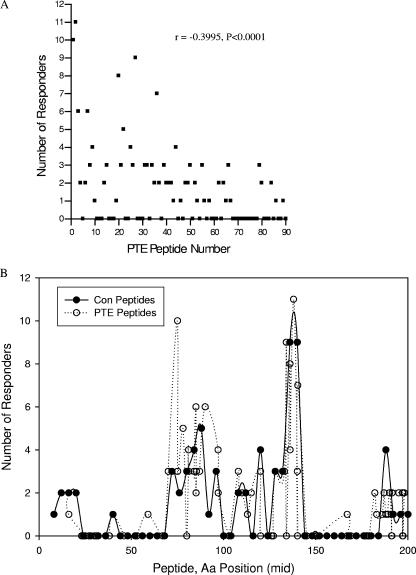
FIG. 2.
Relationship between responder frequency with PTE peptide order (A) and peptide distribution within the Nef protein (B). PBMC were stimulated with HIV-1 PTE and CON peptide sets in a matrix format and tested for IFN-γ production using an ELISPOT assay. Responses >3-fold above background and >50 SFC/106 cells above background were scored positive. All responses were confirmed at the single-peptide level. Shown are the number of subjects responding to each peptide. In panel A, the highest ranking (lower numbers) PTE peptides are those that are present at the highest frequency among the clade B virus sequences in the database. In panel B the position of each CON and PTE peptide is imputed upon the HXB2 position for the middle amino acid in each of the peptides.

