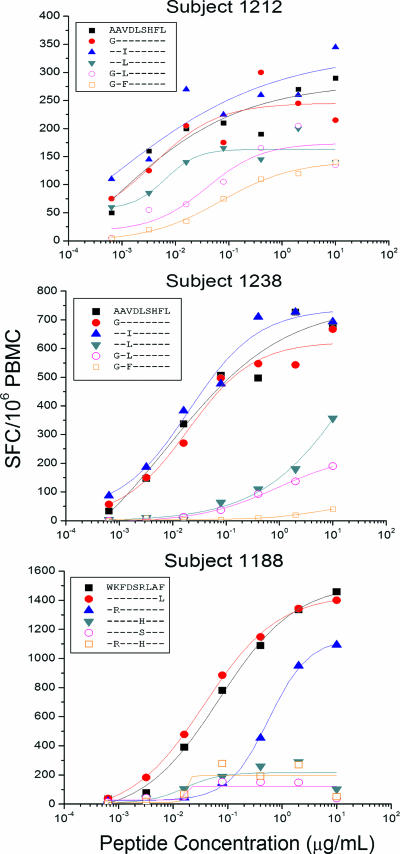
FIG. 3.
Characterization of the T-cell responses to epitope variants AL9/B62 in subject 1212 (top panel), AL9/Cw08 in subject 1238 (middle panel), and WF9/B1503 in subject 1188 (bottom panel). A standard IFN-γ ELISPOT assay was performed by stimulation with the optimal epitopic peptides and variants at serial concentrations between 10,000 and 0.1 ng/ml. Shown here are PBMC responses from subjects 1238 and 1212 (AL9 epitope variants) and subject 1188 (WF9 epitope variants). The SFC frequencies were plotted against the log10 peptide concentration, and the effective peptide concentration that elicited 50% of the maximum T-cell response was determined using ORIGIN 6.0 professional software. Epitope mapping and HLA restriction data were published previously (9).

