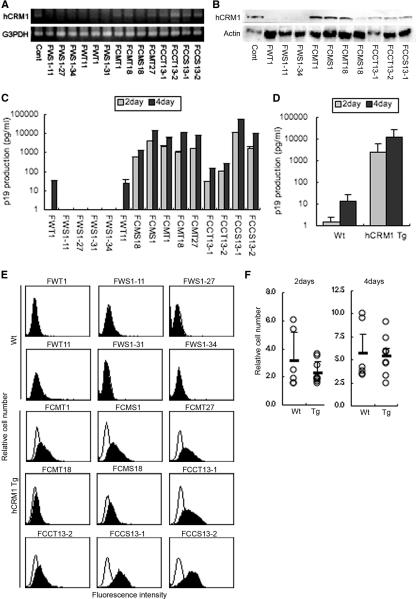
FIG. 4.
Expression of HTLV-1 Gag and hCRM1 in cell lines immortalized with HTLV-1. (A) Detection of the hCRM1 transgene in cell lines by PCR. DNA extracted from each cell line (100 ng) was subjected to PCR with primers for hCRM1 and with primers for G3PDH as an internal control. (B) Protein expression of hCRM1 was detected by immunoblotting. Samples (10 μg of total protein per lane) were subjected to SDS-PAGE. A HeLa cell extract was used as a positive control (Cont). (C) HTLV-1 Gag protein levels in the supernatants of 2-day and 4-day cultures were quantified by an HTLV-1 p19 enzyme-linked immunosorbent assay. Results are means from three independent experiments. (D) Based on the data shown in panel C, the average p19gag production of Tg and Wt cell lines was calculated. (E) The amount of intracellular Gag in each cell line was analyzed by flow cytometry. Open histograms, cells stained with MAbs against p19gag and p55gag; solid histograms, cells stained with control mouse IgG. (F) The growth rates of Wt and Tg cell lines were measured. In parallel with the experiments described in the legend to panel C, the growth rate was monitored by the cell-counting Kit-8 (Dojinndo Laboratories). The relative numbers of cells in 2- or 4-day cultures versus day zero cultures are shown.

