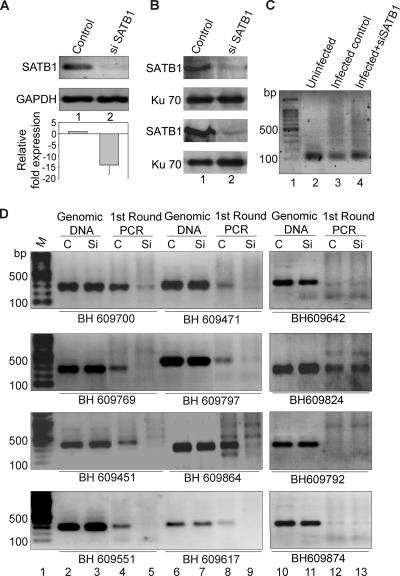
FIG. 5.
Integration of HIV-1 at SATB1-binding regions is disfavored upon siRNA-mediated knockdown of SATB1. PCR analysis of regions flanking HIV-1 integration sites is presented. (A) RT-PCR validation of SATB1 knockdown. Total RNA was isolated and RT-PCR analysis was performed as described in Materials and Methods. RT-PCR products for SATB1 (upper part) from control (lane 1) and shSATB1-transfected (lane 2) HIV-1-infected CEM cells were electrophoresed on 1% agarose gel and visualized by staining with ethidium bromide. GAPDH was used as an internal control for normalization (lower part). The knockdown of SATB1 expression was quantitated by real-time RT-PCR analysis (histogram below). (B) Immunoblot analysis of SATB1 expression in control (lane 1) and siSATB1 (lane 2) cells is presented in two replicates to monitor consistent knockdown of the expression of SATB1. Expression of the Ku 70 subunit of the Ku autoantigen was used as a control (lower part). (C) First round of PCR amplification to isolate the genomic regions flanking the HIV-1 integration sites. Genomic DNA was isolated from HIV-1-infected CEM cells that were transfected with the pSUPER vector (control, lane 3) or pSUPER-shSATB1 (siSATB1, lane 4) and PCR amplified with primer sets containing an LTR-specific primer and a primer specific for one of the Alu-like motifs. Genomic DNA from uninfected CEM cells was used as a control for the PCRs (lane 2). (D) PCR amplification of reported integration sequences (BH series). The second-round PCRs were performed with primers specific for indicated BH series clones and purified DNA templates in the form of genomic DNA or first-round PCR products from control (C, pSUPER vector-transfected) cells and siSATB1 (Si, pSUPER-shSATB1-transfected) cells. Lane 1, 100-bp DNA ladder. The templates used were genomic DNA from control (lanes 2, 6, and 10) or siSATB1 (lanes 3, 7, and 11) cells and first-round PCR products from control (lanes 4, 8, and 12) or siSATB1 (lanes 5, 9, and 13) cells. All PCR products were electrophoresed on 1% agarose gels and visualized by staining with ethidium bromide.

