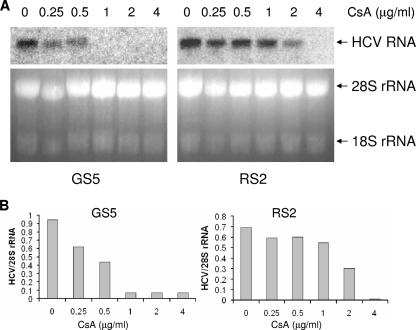
FIG. 2.
Quantification of CsA resistance at the RNA level. (A) A representative Northern blot. The GS5 and RS2 cells were treated with the indicated amounts of CsA for 48 h. Total RNA from the replicon cells was then extracted and subjected to Northern analysis with a radioactively labeled probe that corresponded to the NS5B sequence of the GT1b HCV (29). A photograph of the RNA electrophoresis gel before Northern transfer showed that equivalent amounts of RNA were loaded for each sample. (B) Quantification of the ratio of HCV RNA to 28S rRNA using band densities from panel A. The Northern blot bands were analyzed with a PhosphorImager (Molecular Dynamics; Storm 860 scanner), and the rRNA bands were analyzed with a Bio-Rad ChemiDoc system. The ratio (plotted) serves as an indicator of the HCV RNA steady-state levels in the various samples after normalization to total RNA loaded.

