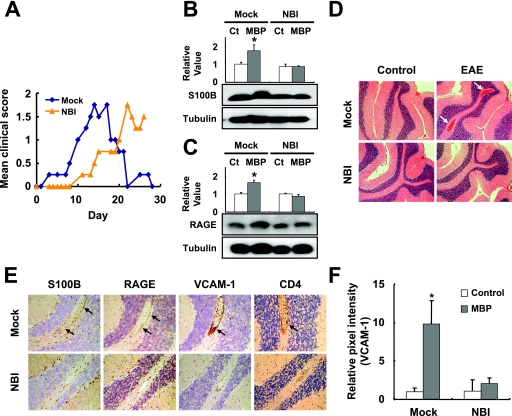
FIG. 4.
Vascular inflammatory responses in EAE-induced rat brains. (A) Clinical symptoms of EAE. The means of daily clinical scores are shown (see Materials and Methods). Expressions of S100B (B) and RAGE (C) in the cerebellum of the BDV-infected rats at 14 days after the MBP injection are shown. Quantitative analyses of the expressions are also shown. The band intensities were determined by NIH image. Values were normalized to the tubulin level. (*, P < 0.05 with PBS-injected age-matched control [Ct] rats). Mock, age-matched mock-infected rats. (D) Neuropathological analysis of MBP-injected rats. Brain sections were stained with H&E. Arrows indicate the regions of vasodilatation in the cerebellum of a mock-infected, EAE-induced rat. (E) IHC analysis of EAE-induced rat brains. Serial brain sections from the cerebellar regions were stained with anti-S100B, RAGE, VCAM-1, and CD4 antibody. Magnification, ×200. Arrows indicate positive signals in the perivascular regions. (F) Quantification of VCAM-1 expression in rat brains. For a quantitative analysis of VCAM-1 levels in the brain, the optical density of positive signals was measured as described in Materials and Methods. All optical density measurements were performed under the same optical and lighting conditions. The relative pixel intensities to PBS-injected control animals are shown. (*, P < 0.05).

