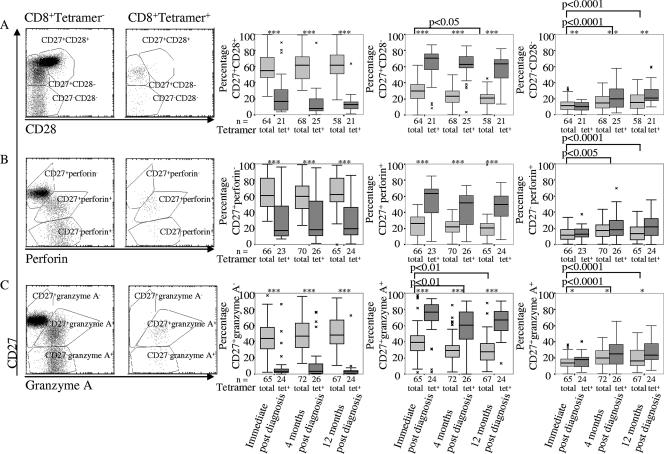
FIG. 4.
CMV-specific CD8 T cells are more differentiated and show higher cytotoxic potential than the remainder of the CD8 T-cell population. (A) Scatter plots of representative samples of tetramer+ and tetramer− CD8 T cells stained for CD27 and CD28 with the indicated populations and the percentage of cells within each population, box plots of all samples indicating medians and interquartile ranges, and differences between the distributions of all populations between sample times indicated. (B) The same data for cells stained for CD27 and perforin. (C) The same data for cells stained for CD27 and granzyme A. The populations are identified, and the percentages indicate the proportion of cells in each of them.

