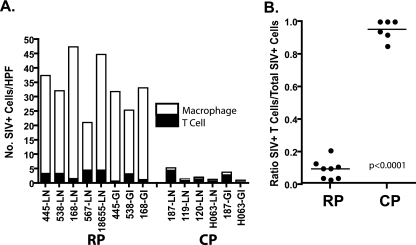
FIG. 8.
Graphic representation of the proportions of SIV-expressing macrophages and T cells in the lymph nodes and ilea of RP and CP macaques. (A) The mean numbers of SIV+ cells per high-power field (HPF) of each type in various tissues of RP and CP macaques are shown by a bar graph where the filled bars represent T cells and the open bars represent macrophages. (B) Ratios of infected T cells to total infected cells in RP and CP tissues, demonstrating a significant difference between these two groups.

