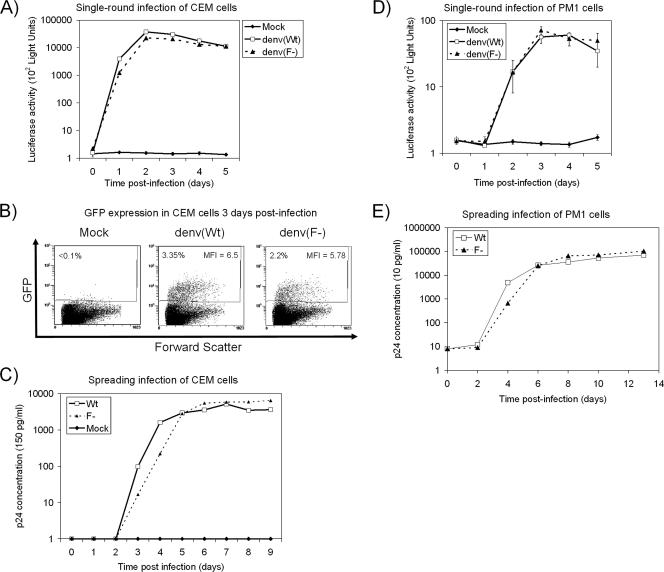
FIG. 2.
Expression and replication kinetics of Wt and F− viruses in transformed CD4+ T-cell lines. (A) CEM cells were either mock infected or infected with equivalent amounts (50 ng of p24) of denv(Wt) or denv(F−) pseudotype viruses. Infected cells were then assessed for luciferase activity in quadruplicate at the indicated times (error bars representing standard deviations are present at all data points but in most cases are too small to be visible). (B) CEM cells infected as described in the legend to panel A were harvested at 3 days postinfection, and GFP expression was quantified using flow cytometry. The percentage of GFP+ cells in each infection and the mean fluorescent intensity (MFI) of GFP+ cells are indicated on scatter plots. (C) CEM cells were either mock infected or infected with Wt or F− replication-competent viruses. After infections, the cells were washed, and aliquots of cell-free supernatant were removed at the indicated times for quantitation of p24 by enzyme-linked immunosorbent assay. (D) PM1 cells were mock infected or infected with either denv(Wt) or denv(F−) pseudotype viruses in the same manner as described for CEM cells in the legend to panel A, and quadruplicate wells were harvested at the indicated times (mean values ± standard deviations are shown). (E) PM1 cells were infected with replication-competent viruses as described for CEM cells in the legend to panel C and assayed for p24 production.

