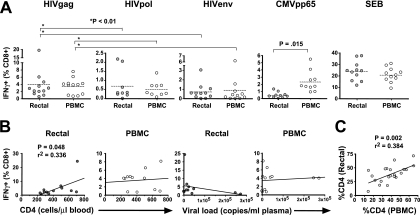
FIG. 2.
IFN-γ production in response to HIV and CMV peptides. This figure summarizes phase I of the study, in which we assessed IFN-γ production in PBMC and rectal cells in response to HIV Gag, Pol, and Env peptides, CMV pp65, and SEB. (A) Response magnitudes (y axis) in rectal MNC and PBMC are reported as the percentages of CD3+ CD8+ lymphocytes producing IFN-γ after background subtraction. Dashed lines indicate mean values. Two-tailed, paired t tests were used to compare responses in rectal MNC and PBMC; P values are shown only where significant differences were found (P < 0.05). Multiple comparisons (*) were performed using Kruskal-Wallis tests, followed by Dunn's multiple-comparison test. (B) Linear regression analyses were performed to compare blood CD4+ T-cell counts and plasma viral loads to the magnitude of HIV Gag-specific IFN-γ responses in the rectum and PBMC (Spearman correlation). P values are shown only where significant relationships were found (P < 0.05). (C) Linear regression analysis revealed a significant correlation between the percentages of CD4+ T cells in rectal mucosa and PBMC (Spearman correlation).

