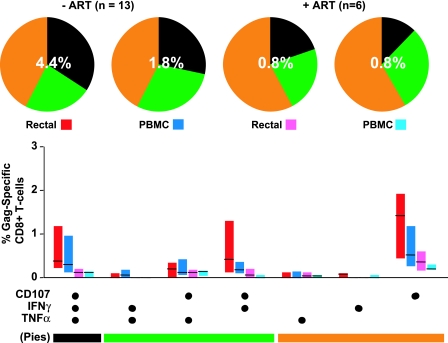
FIG. 3.
Five-color, three-function analysis of HIV Gag-specific responses. This figure summarizes data for all 19 patients enrolled in phase II of the study (Table 1). Bar graphs show the magnitude of HIV Gag-specific responses in each functional category, expressed as a percentage of CD8+ T cells after subtraction of background values. Values below the cutoff of 0.05% were dropped. Bars indicate interquartile ranges, ranging from the 25th to the 75th percentile. The median response for each category is indicated by a horizontal black line. The combination of functions evaluated in each category is shown below the bar graphs; these combinations have been color coded and correspond to slices of the pie charts above. In the pie charts, triple-function responses (expressing CD107, IFN-γ, and TNF-α) are coded as black, dual-function cells are coded as green, and single-function responses are coded as orange. The percentages superimposed on the pie charts represent the mean total-response magnitude (i.e., all nonoverlapping functional groups combined) for each patient group and tissue site.

