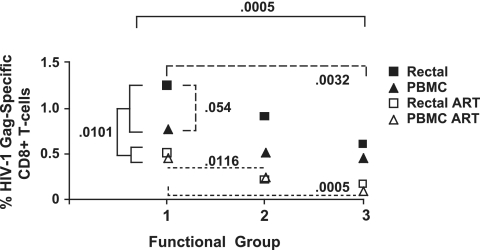
FIG. 4.
Statistical analysis. This figure summarizes the results of multivariate analysis as described in the text. Single-, dual-, and triple-functional CD8+ T cells are indicated as functional groups 1, 2, and 3, respectively. Numbers on the y axis indicate mean HIV Gag-specific responses for patients on ART (open symbols) or not on ART (filled symbols). The response magnitude differed significantly between subjects who were on ART and subjects who were not (P = 0.0101) (solid brackets) and between functional groups when single-, dual-, and triple-function responses from all patients were compared (P = 0.0005) (solid brackets). Among subjects not on ART, there were significant differences between functional groups 1 and 3 (P = 0.0032) (broad dashes) and a borderline significant difference between rectal and PBMC responses (P = 0.054) (broad dashes). Among those on ART, there were significant differences in magnitude between groups 1 and 2 and between groups 1 and 3 (P = 0.0115 and 0.0005, respectively) (narrow dashes).

