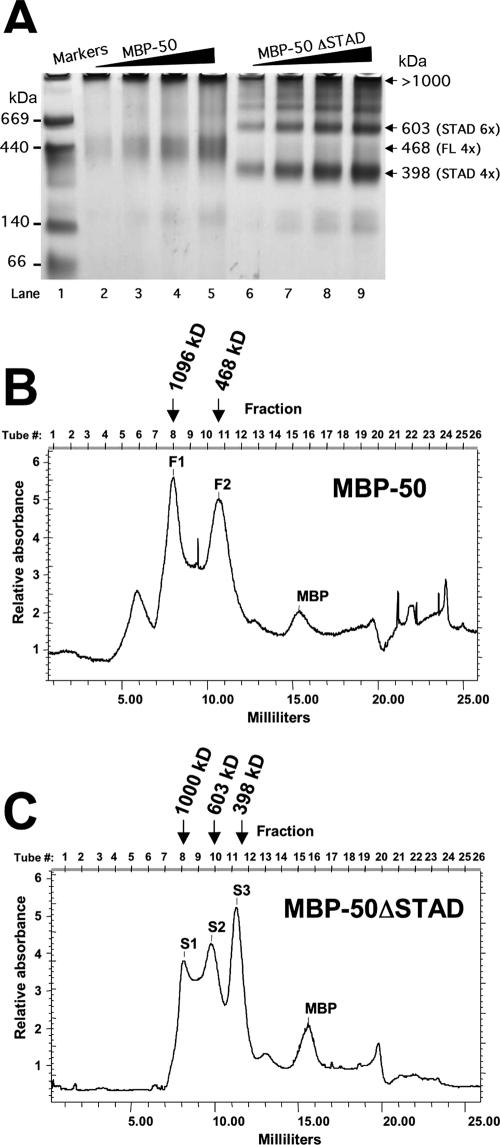
FIG. 8.
Multimerization of MBP-ORF50 and MBP-50ΔSTAD. (A) BN-PAGE. One to three micrograms of MBP-50 or MBP-50ΔSTAD was analyzed by BN-PAGE on 4% to 12% Bis-Tris gradient gels, as described in Materials and Methods. When the dye front reached the bottom, the gel was destained and analyzed by capturing a digital image in visible light. The migration position of the molecular mass markers is shown at the left. The numbered arrows on the right show migration positions of the MBP fusion protein complexes; apparent molecular masses were determined by gel exclusion chromatography as for panels B and C. (B and C) Gel filtration chromatography. MBP-50 (B) or MBP-50ΔSTAD (C) was separated by gel filtration chromatography, using a Superdex200 HR 10/30 column, as described in Materials and Methods. Fractions (0.5 ml) were collected, and protein content was measured by optical density at 280 nm. The peaks are labeled F1 and F2 for full-length ORF50 and S1, S2, and S3 for ORF50ΔSTAD. The molecular mass of each peak is shown above each elution profile; the molecular mass was determined by comparison to the elution profile of thymoglobulin, ferritin, and catalase (Table 1). MBP fusion proteins, or MBP alone, was identified in the indicated peaks by Western blotting, using anti-MBP antibody (data not shown).

