
Figure 4.
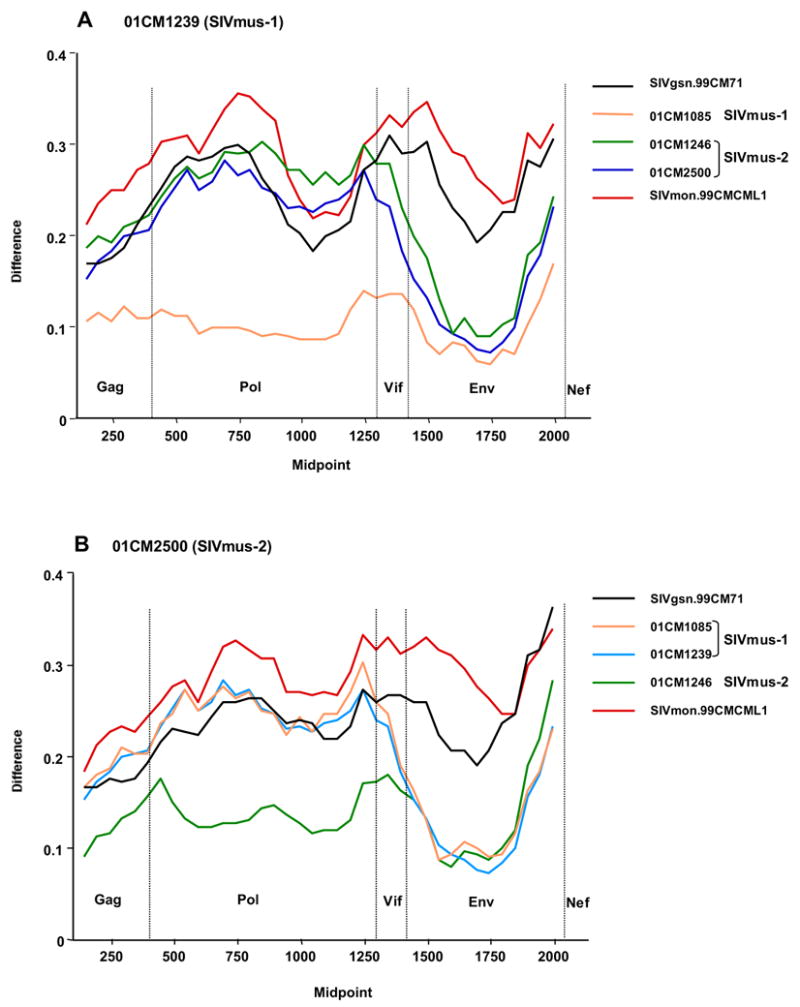
Diversity plots of concatenated Gag, Pol, Vif, Env and Nef protein sequences showing distance from SIVmus-01CM1239 (A) and SIVmus-01CM2500 (B) to other viruses of the SIVgsn/mus/mon lineage. The proportion of amino acid sequence difference per 300 residues window (vertical axis) is plotted against the midpoint of the sequence window (horizontal axis).