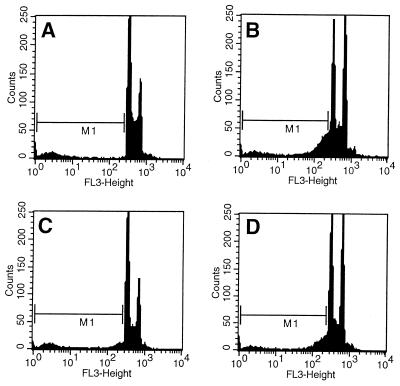
Figure 4.
Apoptotic DNA degradation induced by taxol in the presence or absence of FTI. The logarithmic fluorescence intensity is shown for several arms of the experiment described in Fig. 3 to highlight cells with sub-G1 DNA content due to apoptotic DNA degradation (indicated by the M1 gate). The histograms correspond to A (0 taxol, 0 FTI) and B (8 nM taxol, 0 FTI), showing the characteristic DNA degradation seen with taxol-induced apoptosis in these cells. Histograms C (4 nM taxol, 0 FTI) and D (4 nM taxol, 1 μM FTI) demonstrate cells that become blocked in mitosis largely because of the addition of FTI, and this block also is characterized by apoptotic DNA degradation.

