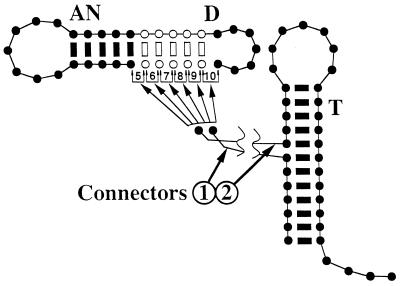
Figure 1.
The base-pairing pattern of mitochondrial tRNAs. This representation inspired by the three-dimensional L structure of the tRNA shows schematically how changes in the number of base pairs in the anticodon stem and those of the D-stem and the number of nucleotides in the connector regions can be compensatory (1–5). Each black or white circle represents a nucleotide, and pairing is indicated by a bar between positions. Alternate structures are produced by attaching the connector regions to the two nucleotides indicated in the boxes from 5 to 10. These numbers also represent the number of base pairs in the structure resulting from the attachment. AN refers to the anticodon loop and adjacent stem; D, to the D-loop and -stem; and T, to the T-loop and -stem.

