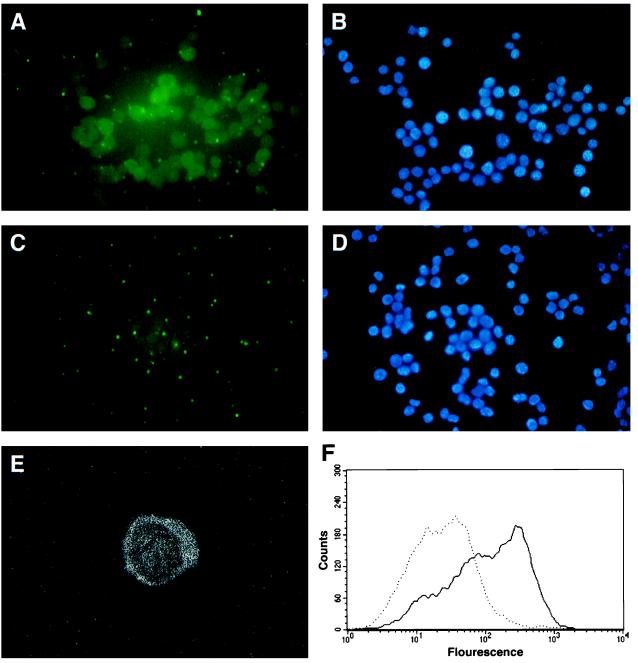
Figure 3.
Cellular uptake of PNAs. Cells were permeabilized with SLO in the presence of fluorescein-conjugated PN-10 (Table 1) at a concentration of 1 μM. Fifteen minutes later, the cells were fixed in paraformaldehyde and examined by using a fluorescent microscope at ×40 power (A), with the 4′,6-diamidino-2-phenylindole (DAPI) staining shown in B. Cells treated with PNA but without SLO permeabilization are shown in C, with the associated DAPI stain shown in D. Cells were also examined with a laser scanning confocal imaging system (Bio-Rad MRC600) (E). The confocal images were captured by using a ×63 C-apochromat oil phase lens (Zeiss Axiovert 10 microscope). The percentage of cells taking up the fluorescein-tagged PNA was further quantified by flow cytometry (F). The solid line indicates the fluorescence profile obtained when cells were treated with the fluorescein-tagged PNA following permeabilization with SLO. The dotted line shows the profile of cells treated with the PNA in the absence of permeabilization.

