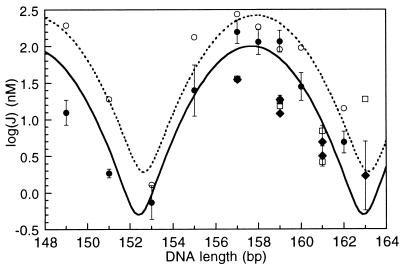
Figure 3.
Comparison of ATF/CREB site cyclization kinetics data and Monte Carlo simulation results for free DNA. Experimental J factors for in-phase constructs are filled circles with error bars: 7T9 (149 bp), 9T9 (151 bp), 11T9 (153 bp), 13A9 (155 bp), 15A9 (157 bp), 15A11 (158 bp), 17A9 (159 bp), 17A11 (160 bp), and 19A11 (162 bp). The in-phase data (solid line) and simulations are fit to sums of Gaussians as previously described (31). The simulation results are represented by open circles, and their curve fit is the dotted line. J factors for the out-of-phase molecules 9T15 (157 bp), 11T15 (159 bp), 13T15 (161 bp), 9A17 (159 bp), 11A17 (161 bp), and 13A17 (163 bp) fall below the in-phase values. Filled diamonds with error bars are the experimental values, and open squares represent the simulation results.

