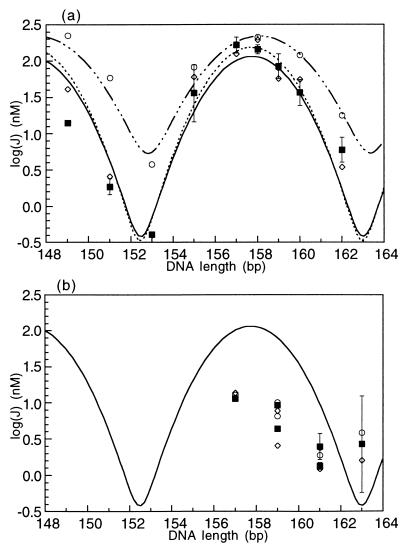
Figure 4.
Comparison of ATF/CREB site cyclization kinetics data and Monte Carlo simulation results for protein-bound DNA. (a) J factors for in-phase constructs bound to protein, either full-length GCN4 or the bZIP peptide. Experimental values are the filled squares and are fit with the solid line. The curve fit is identical to the one for the DNA alone shown in Fig. 3. In both cases, the optimal cyclization length is 157.7 bp. Open circles and the dash-dot curve fit are the Monte Carlo results from modeling the ATF/CREB site with a decreased bend angle of 7°. Open diamonds and the dashed line are the Monte Carlo results for decreased flexibility of the site, characterized by a P of 144 bp. (b) Results for out-of-phase constructs, showing the fit of the two theoretical models (open symbols as in (a)) to the experimental results (filled squares).

