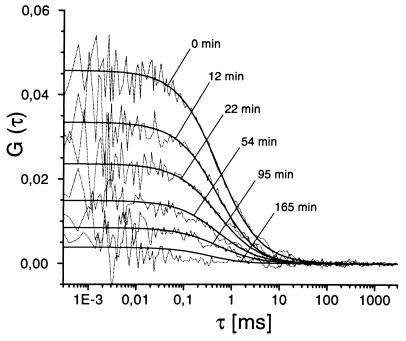
Figure 3.
Cross-correlation curves at different time points during an endonucleolytic cleavage reaction. The 10 nM labeled DNA, the 80 nM unlabeled DNA, and the 1.6 nM EcoRI were incubated in the reaction buffer at 27°C. Dotted lines are the original data, which were fitted with Eqs. 2a and 3. The fitted curves are given in solid lines. During the reaction the cross-correlation amplitude Ggr(0), which is a measure of the reaction progress, gradually decreases.

