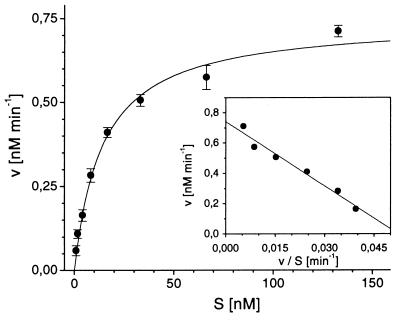
Figure 5.
Michaelis–Menten plot. Labeled DNA at a final concentration of 0.8 nM was mixed with different amounts (0–130 nM) of unlabeled DNA and incubated with 160 pM EcoRI in the reaction buffer at 27°C. The reactions were monitored on-line and the initial rates v were derived by linear regression of data points of the first 5–20 min. (Inset) Calculations from an Eadie–Hofstee plot lead to a KM value of 14 ± 1 nM and vmax of 0.74 ± 0.03 nM min−1.

