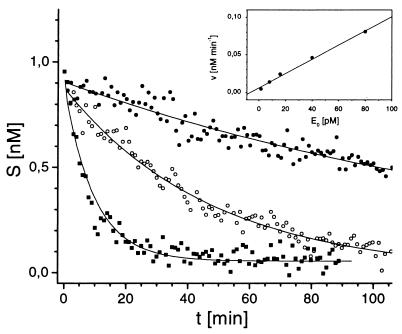
Figure 6.
Reaction rates at different enzyme concentrations. Endonucleolytic reactions were carried out in the reaction buffer at 27°C with 0.8 nM doubly labeled DNA substrate and different enzyme concentrations ranging from 1.6 to 80 pM. Time courses are shown for E0 = 1.6 pM (•), 8 pM (○), and 80 pM (▪). (Inset) Initial rates v were calculated from linear regression of the data points of the first 5–50 min; the plots of these initial rates versus enzyme concentrations E0 indicate a strong linear relationship between v and E0.

