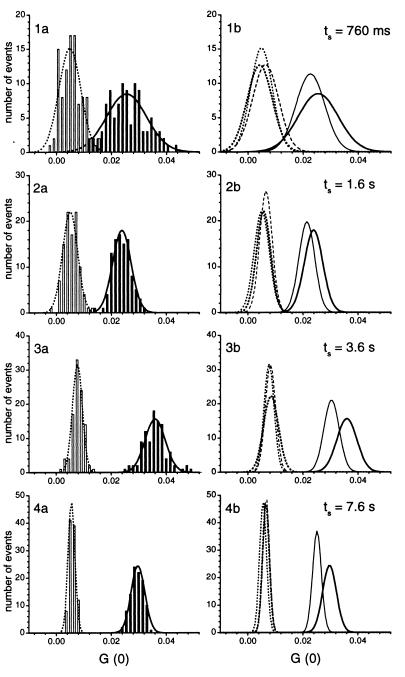
Figure 5.
Application of RAPID FCS for a simulated HTS for restriction endonucleolytic activities. The samples were screened in a circular manner for a total of 500 measurements at each analysis time. Left-hand plots (1a–4a) compare the distributions of samples with (BamHI, open bars) and without specific endonucleolytic activity (HindIII, solid bars) for analysis times of 760 ms, 1.6 s, 3.6 s, and 7.6 s. Distributions of the cross-correlation amplitudes G(0) were evaluated as described in the legend of Fig. 3 with bin sizes of 0.0015. The right-hand plots (1b–4b) show the ability to separate the different restriction endonucleases by their extracted Gaussian fittings with pure substrate (solid lines), HindIII (bold solid lines), BamHI (bold dotted lines), EcoRI (dotted lines), and SspI (dashed lines). The overlaps were 2.6–5.4% (760 ms), 0.1% (1.6 s), <0.002% (3.6 s), and ≪ 10−5% (7.6 s). Assays were performed in 5 μl volumes with 10 nM labeled DNA substrate, incubated for 3 h at 37°C with 0.25 unit/μl HindIII, 0.1 unit/μl BamHI, 0.25 unit/μl EcoRI, 0.08 unit/μl SspI and without enzyme addition. Excitation power densities of 19 kW/cm2 (488 nm) and 15 kW/cm2 (633 nm) and a pinhole diameter of 30 μm were applied. During the time of sample positioning the beams of the excitation lasers were blocked by an automatic shutter control.

