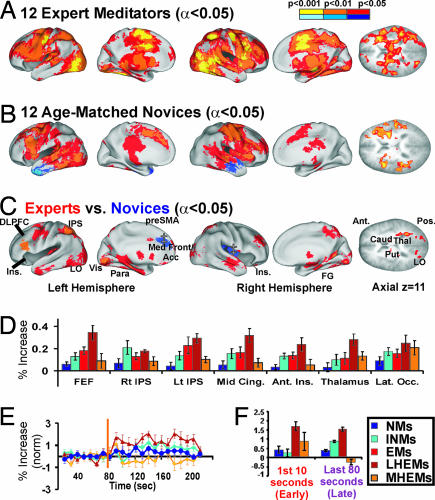
Fig. 1.
Meditation block data. Activation in concentration meditation block (Med.) vs. resting state block (Rest) for 12 EMs (A), 12 age-matched NMs (B), and t test subtraction of EMs (C) (red hues reflect greater activation in EMs vs. NMs) vs. regular NMs (blue hues reflect greater activation in NMs vs. EMs). Alpha maps ranging from P < 0.001 (orange, positive activation; medium blue, negative activation) to P < 0.01 (orange/medium blue) to P < 0.05, corrected (red, positive activation; dark blue, negative activation) are overlaid on inflated population-average, landmark- and surface-based atlas cortical model brains and an axial slice at z = 11 to show midbrain regions. ‡, smaller than corrected for multiple comparisons. (D) Activation in attention-shifting metaanalysis ROIs. Color scale is the same for all panels (see key). (E) Response over time (seconds) for left DLPFC. Start of the meditation block is indicated by an orange line at 80 sec. Standard error bars are shown for every 10 sec. (F) Bar graphs for amplitude of activation in DLPFC in the “early” part of the meditation block (the first 10 sec, excluding the first 2 sec because of hemodynamic delay) and the “late” part of the meditation block (120 sec to 200 sec).

