
Fig. 2.
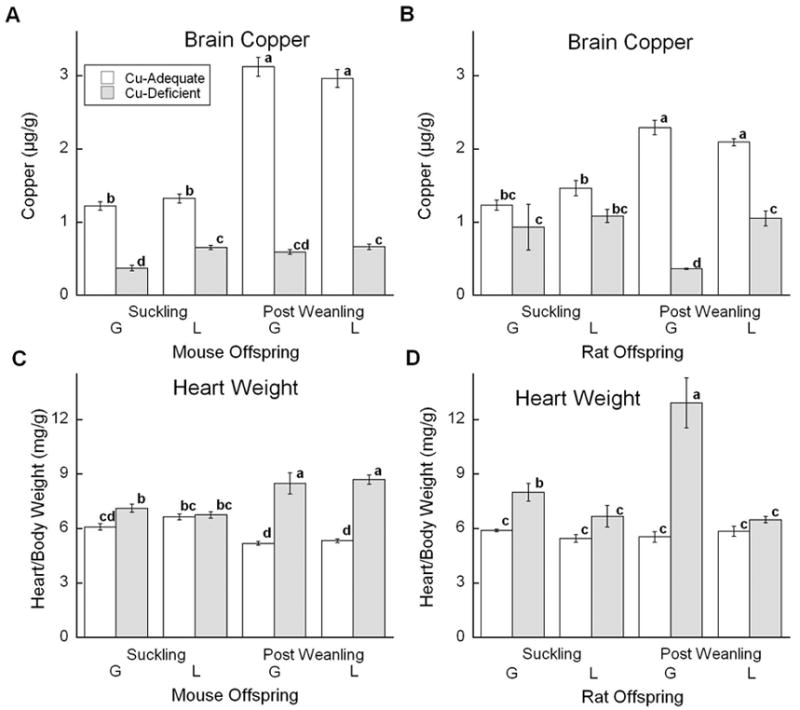
Effects of Cu deficient dietary treatment during G or L on brain Cu and cardiac hypertrophy (heart weight/body weight). (A) and (C) Suckling mice at P12 and Post Weanling at P27 were sampled. Each bar represents the mean ± SEM (n=4–7). (B) and (D) Suckling rats at P13 or P14 and Post Weanling at P21 or P24 were sampled. Each bar represents the mean ± SEM (n=4). Significantly different values are denoted by unlike lower case letters. Data were analyzed by factorial ANOVA and significant interactions were compared by Fisher’s PLSD, α =0.05.