
Figure 2. Distribution and viability of hESC aggregates encapsulated within bioactive dextran-based hydrogels.
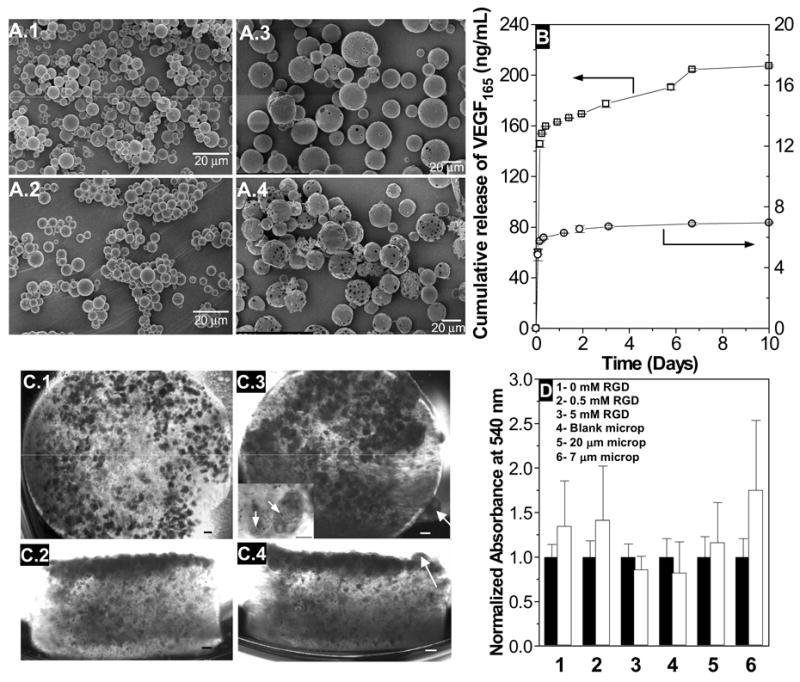
A) Scanning electron micrographs of 7 μm (A.1, A.2) and 20 μm (A.3, A.4) PLGA microparticles at day 0 (A.1, A.3) and 10 (A.2, A.4), during the release of VEGF165. B) Release profile of VEGF165 from 7 μm (□) and 20 μm (○) microparticle formulations. C) Distribution of hESC aggregates on dextran-based hydrogels with 0.5 mM Acr-PEG-RGD and 5 mg/mL VEGF-loaded 20 μm microparticles, at day 0 (C.1, C.2) and day 10 (C.3,C.4). Top (C.1, C.3) and side (C.2, C.4) views. Arrows in C.3 and C.4 indicate clump of cells proliferating outside the hydrogel. Inset in C.3 shows the incorporation of microparticles (arrow) within the hESC aggregates. Scale bar corresponds to 200 μm. D) Mitochondrial metabolic activity (average ± SD, n=6) of hESC aggregates encapsulated in dextran-based hydrogels with no Acr-PEG-RGD (1), 0.5 mM Acr-PEG-RGD (2), 5 mM Acr-PEG-RGD (3), 0.5 mM Acr-PEG-RGD with 5 mg/mL of blank microparticles (4), and 0.5 mM Acr-PEG-RGD with 5 mg/mL of VEGF165 loaded 20 μm (5) or 7 μm (6) microparticles. The absorbance at 540 nm was measured after 1 day (black bars) and 10 days (white bars). Both absorbances were normalized by day 1 absorbance.