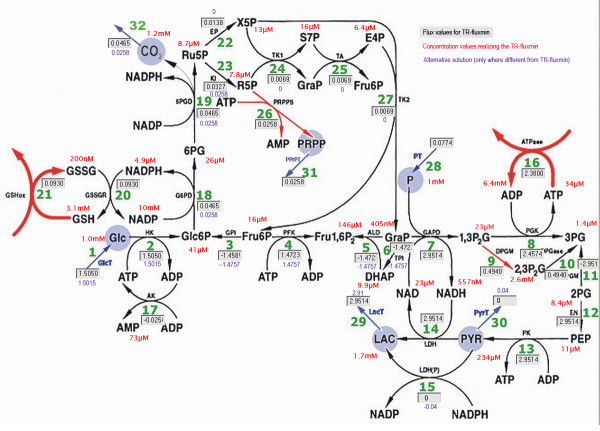
Figure 2.

Reaction scheme of the human erythrocyte network. The flux values of the TR-fluxmin solution are marked in the boxes with grey background (fluxes in mmol/h). The observed concentration values used as set-points are given in red near the metabolite. Flux values of the first alternative TR-fluxmin solution that appeared in the perturbation analyses are written in violet near to the boxes if they differ from the value inside the box. The scheme has been generated with the aid of the program 'FluxAnalyzer' [44].
