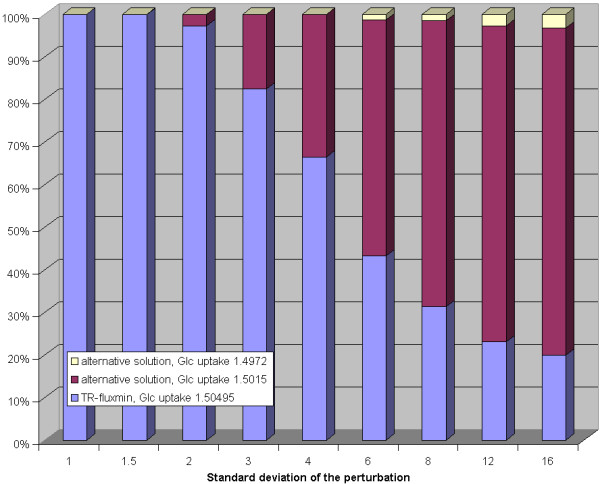
Figure 3.

Impact of random perturbations of observed metabolite concentrations on calculated flux distributions for the erythrocyte network. Each bar shows the relative frequency of alternative flux distributions (y-axis) in dependence on the standard deviation of the perturbation (x-axis) of the set-point concentration values. The perturbationanalysis is based on random numbers generated with the Cliff random number generator [45] transformed to normal distribution by theBox-Muller method [46] where the expectation value is fixed to zero and for each series (1000 runs) the standard deviation is fixed to a specified value (given in the figures). For the perturbation of the concentrations each concentration value is multiplied with eX where X is a newly generated pseudo-random number. Each concentration value is modified independently from the perturbation of the other concentration values. The standard deviation value s can be translated to a 'deviation factor' as es. For the perturbation of the equilibrium constants each value is also multiplied with eX where X is a newly generated pseudo-random number. After the perturbation the values are modified again to ensure well-formedness by the algorithm described in the text. The standard deviation value s can be translated into deviations of Gibb's free energy change as 2.58·s kJ/mol.
