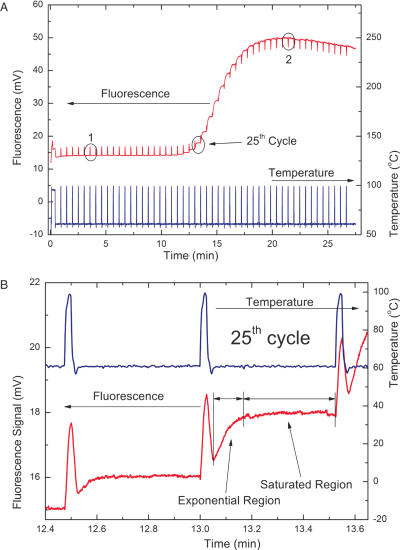
Figure 4.
A typical real-time PCR curve showing the PCR thermal profile (blue) and fluorescence signal (red) for a complete 50 cycle PCR (upper figure). The critical threshold (CT) was determined by plotting the mean value of the fluorescence signal of the last 5 s at each cycle versus cycle number on a logarithmic scale. We have found that the CT value was 20.7. The fluorescence signal versus temperature graph shows a typical trend for a FAM probe-based system. At the beginning of the PCR cycling, the fluorescence increases with the temperature (1) while after successful PCR amplification shows the opposite trend (2). The fluorescence as well as the temperature signals detected within the 24th and the 25th thermal cycles are also shown (lower figure). The fluorescence signal within each step consists of two regions, one exponential and the other saturated (indicated by arrows). Within the 25th cycle the saturated part of the fluorescence signal is three times longer than the exponential part. The significance of this finding will be discussed later.

