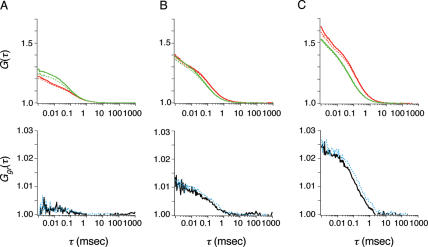
Figure 3.
FCCS analysis of AP-1-binding proteins. The autocorrelation function (upper panels) and cross-correlation function (lower panels) of c-FosCy5 and c-FosRhG (A), c-JunCy5 and c-JunRhG (B), and c-JunCy5 and c-FosRhG (C). In the autocorrelation plot, red and green lines represent Cy5 and RhG. The dashed curves (blue in cross-correlation function) represent data obtained after the addition of 50 nM AP-1 oligonucleotides.

