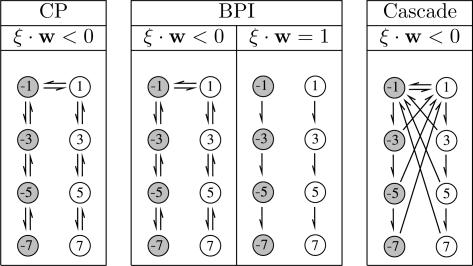
Fig. 1.
Schematic representation of transitions between synaptic states in the CP algorithm and the BPI algorithm. The cascade model introduced by Fusi et al. (12) is shown for comparison. Circles represent the possible states of the internal synaptic variable hi. Gray circles correspond to wi = −1, and white circles correspond to wi = 1. Clockwise transitions happen when ξi = 1, and counterclockwise transitions happen when ξi = −1. Horizontal transitions are plastic (change value of synaptic efficacy wi), and vertical transitions are metaplastic (change internal state only). Downward transitions make the synapse less plastic, and upward transitions make the synapse more plastic. When the output of the neuron is erroneous, ξ · w < 0: transitions occur to the nearest-neighbor internal state. In the CP algorithm, when the output is correct, ξ · w > 0: no transitions occur. In the BPI algorithm, when the output is barely correct, ξ · w = 1 (a single synaptic flip could have caused an error): transitions are made toward less plastic states only. When the output is safely correct, ξ · w > 1: no transitions occur. In the cascade model, “down” transitions are toward nearest neighbors, whereas “up” transitions are toward the highest state with opposite sign. Transition probabilities decrease with increasing |h| (see ref. 12 for more details).

