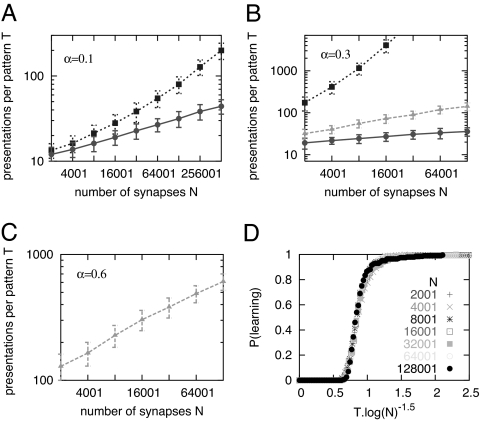
Fig. 2.
Performance of the BPI algorithm with unbounded hidden variables. (A–C) Convergence time vs. N for different values and α (indicated on each graph). Points correspond to the number of iterations per pattern until the algorithm converges averaged over 200 pattern sets; vertical bars are standard deviations. Dotted lines, CP; solid lines, BPI; dashed lines, SBPI with ps = 0.3. The latter is the only one that can reach α = 0.6 but performs worse than BPI for α ≤ 0.3 (it is absent from A for clarity). (D) Probability that the BPI algorithm learns perfectly 0.3 · N patterns in less than T = x · log(N)1.5 iterations per pattern vs. x for various values of N.

