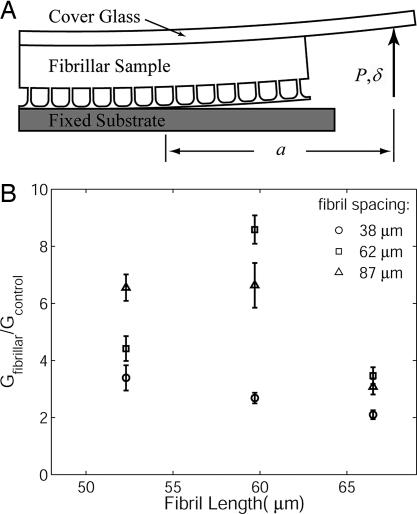
Fig. 2.
DCB experimental geometry and results. (A) Modified DCB experimental geometry. Displacement δ is controlled while the load, P, and crack length, a, are measured. (B) Normalized energy release rate G is calculated from the data by using Eq. 1 and is presented here as a function of fibril length and spacing. Results are quotients of mean values, with five trials performed to obtain each mean. Error bars were calculated by assuming that both fibrillar and control samples have random, independent uncertainty of 1 SD.

