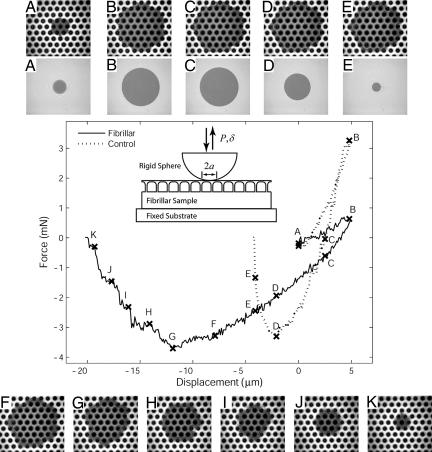
Fig. 3.
Indentation experimental observations. The plot shows typical force–displacement data for shallow indentation of a flat control and a fibrillar sample (fibril length = 60 μm, nearest neighbor spacing = 62 μm). (Inset) Geometry of the indentation experiment. Displacement δ is controlled while the load, P, and contact radius, a, are measured. (Compressive force and displacement into the sample are taken to be positive.) Relative displacement between the indenter and sample increases initially until an indentation depth of 5 μm is reached and then decreases until complete separation occurs. (A–K) Photos corresponding to points indicated on the force vs. displacement curves.

